


提到Web前端的性能优化,有许多的技巧是聚焦在如何减少页面的「加载时间 Loading Time」,例如 Code Splitting 通过减少需要加载的 Bundle Size 来加快加载效能。 也有些技巧是针对执行时期(Runtime)的优化与调教,例如 Virtualized List 通过控制渲染的 DOM 元素数量来保持页面的流畅性,又或者是页面的 Repaint、Reflow、 Composite 等渲染流程所花费的时间,不过这些 runtime 指标又该如何 debug 呢? 什么样的状况又代表着页面的效能可能出现了一些瓶颈呢? 在现今网页中动画占了十分重要的部分,那动画的效能又该怎么观测呢?
今天想透过这篇文章与各位分享如何透过 Chrome Devtool 的 Performance Tab 来检测网页在执行时的各种性能指标,让网页的 Runtime Performance 不再成为你 debug 时的瓶颈!
Chrome Devtool Performance Tab 的基本介绍
目录
有使用过 Chrome Devtool Performance Tab 的读者可能曾经也和我一样被丰富的图表与复杂的信息给吓到了,完全不知道要从何开始看起。 的确 Chrome 的 Performance Tab 提供了相当丰富的信息,要在一篇文章就整理透彻几乎可以说是不可能的任务,所以今天只会介绍最基本的信息与图表,但我认为也已经足够面对平常 Debug 时的需求。 那我们就废话不多说,直接开始吧!
开始 Debug
首先开启一个无痕窗口并造访今天作为范例的网站,使用无痕窗口的原因是可以确保 chrome 是运行在 clean state 下的,不然 performance 的测量结果有可能被 extensions 等正在运行的其他应用影响,造成不够准确的状况。
接着在键盘输入 Command+Option+I (Mac) 或是 Control+Shift+I (Windows, Linux) 打开 Devtool 并点击 Performance Tab。
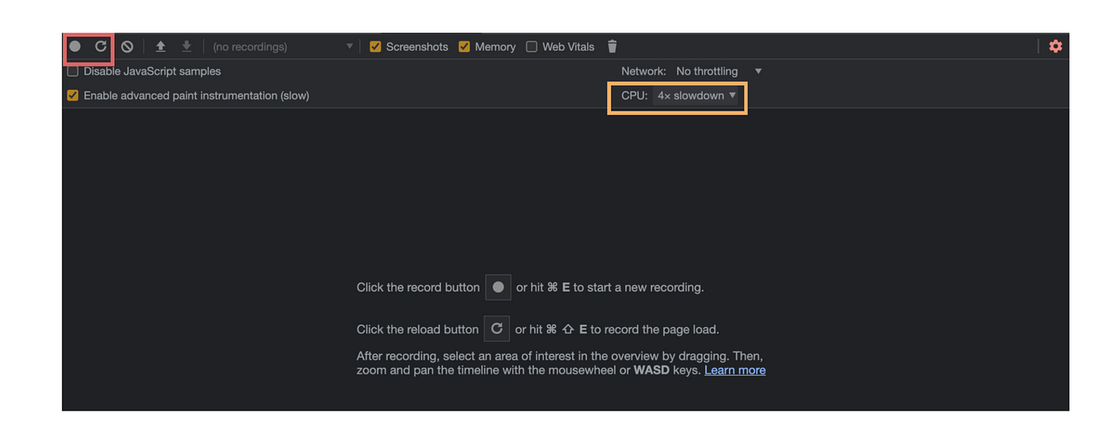

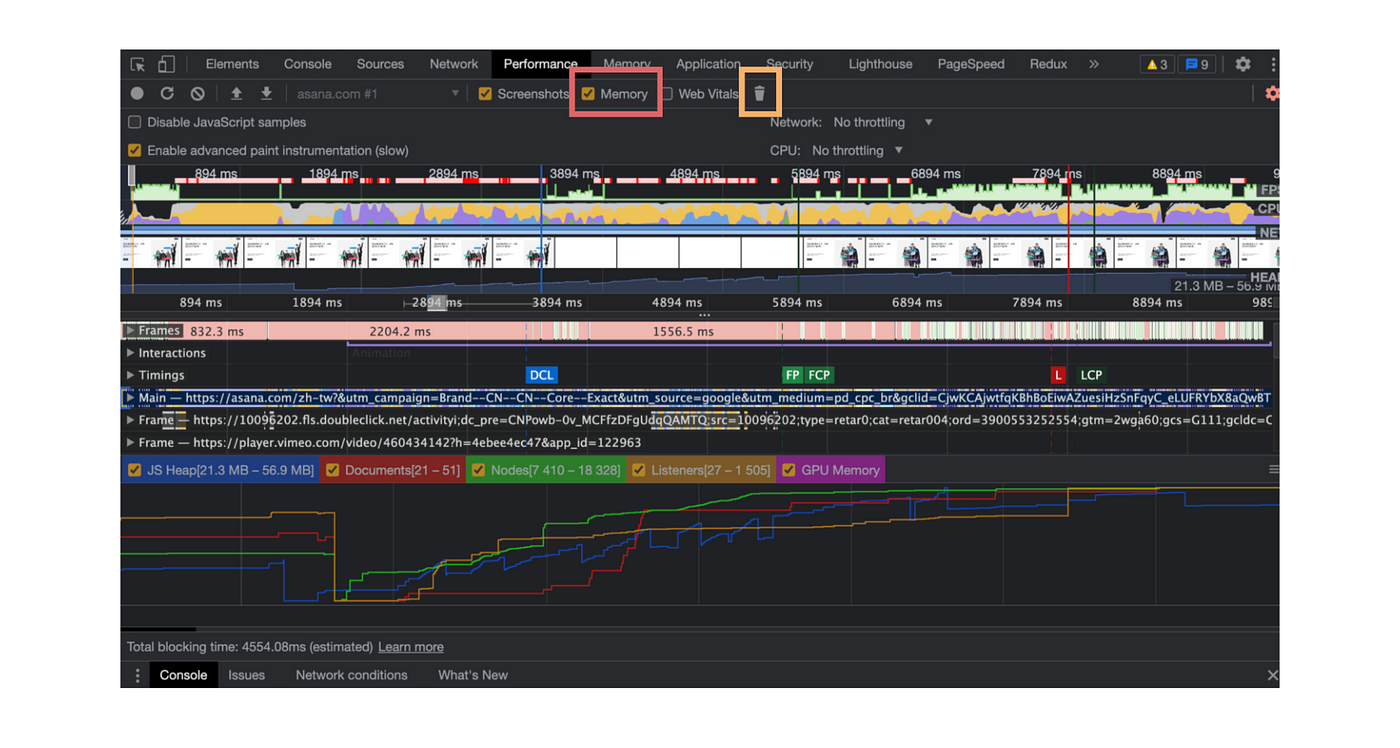
左上角会有两个按钮(红色框框区块),点击第一个即会开始纪录,这时候你可以开始操作网页,Devtool会纪录操作网页时的CPU、内存、Frame Rate等使用量与指标,这种方式适合监测页面上的某些特定行为与功能。
第二颗按钮「Start profiling and reload page」,会开始 profiling 并重新整理页面,并在浏览器认为页面互动告一段落后自动停止 profiling。
因为我想要检测的是用户手动触发的页面动画,所以使用第一种方式会比较适合。 另外如果你的网站也有手机版的需求,一般来说有些 Mobile Devices 的性能会比较差,为了检测应用在 low-level 的 Mobile Devices 是否也能够流畅的运作,可以选择 CPU 选项(图中橘色区块)并调整 CPU 的性能,这边我选择 6x slower 来模拟在性能低的设备运作的状况。 点击开始检测后,操作一下想要检测的功能,点选 stop profiling,一段时间后 Devtool 就会呈现 Profiling 的结果。
分析一下 Profiling 的结果吧!

让我们一步一步拆解,首先来看看纪录 FPS、CPU、NET 的图表区域。


FPS
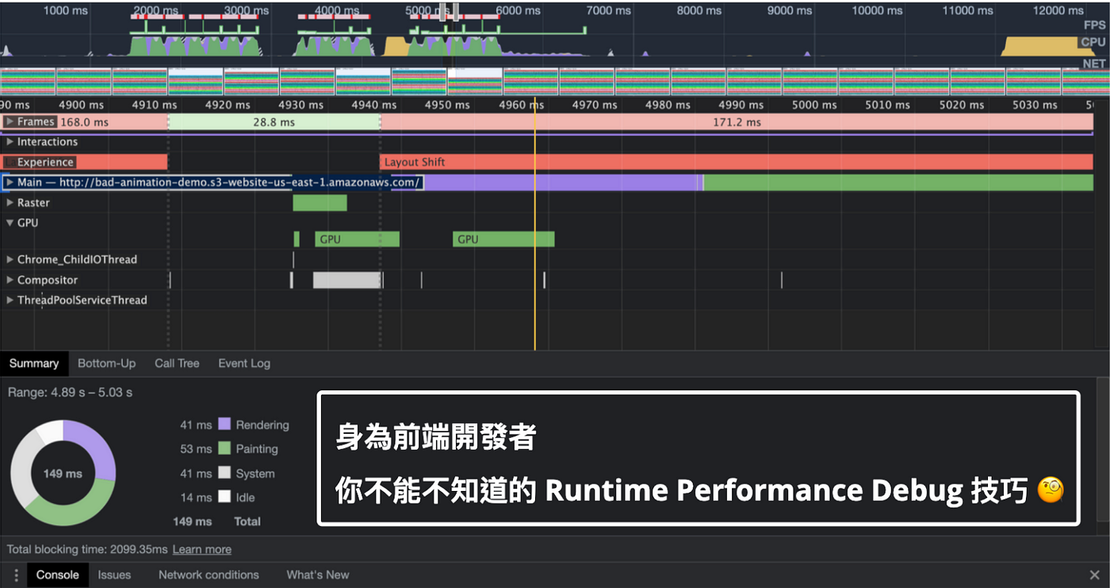
提到测量网页动画的效能,最直觉的方式就是观察 FPS (Frame Per Second),也就是常常听到的 Frame Rate。 当在进行动画时,会希望 Frame Rate 可以达到 60 FPS 左右,用户看到的动画才不易产生卡顿。 (有时候 FPS 很低也不一定不好,也有可能是页面真的没有任何的动静)
在上图的 FPS 字段可以看到粉红色与红色组成的 bar,这代表这页面可能会有掉帧的状况,这会导致页面动画不平顺甚至卡顿,严重影响用户体验,是我们应该要尽量避免的。
CPU
从上图可以看到 CPU 图表是有时段性的,有些区段看起来十分活跃,有先区段看起来却几乎没有在运作。 鼠标在 FPS、CPU、NET 上 hover 都可以看到 profiling 过程完整的 Screenshot,这种技术也叫做 scrubbing,可以让我们以渐进式的方式追踪页面动画。
从上面的 Screenshot 可以得知在用户点击重新排列触发动画一直到动画完成之间的时间都会让 CPU 的使用量提高。
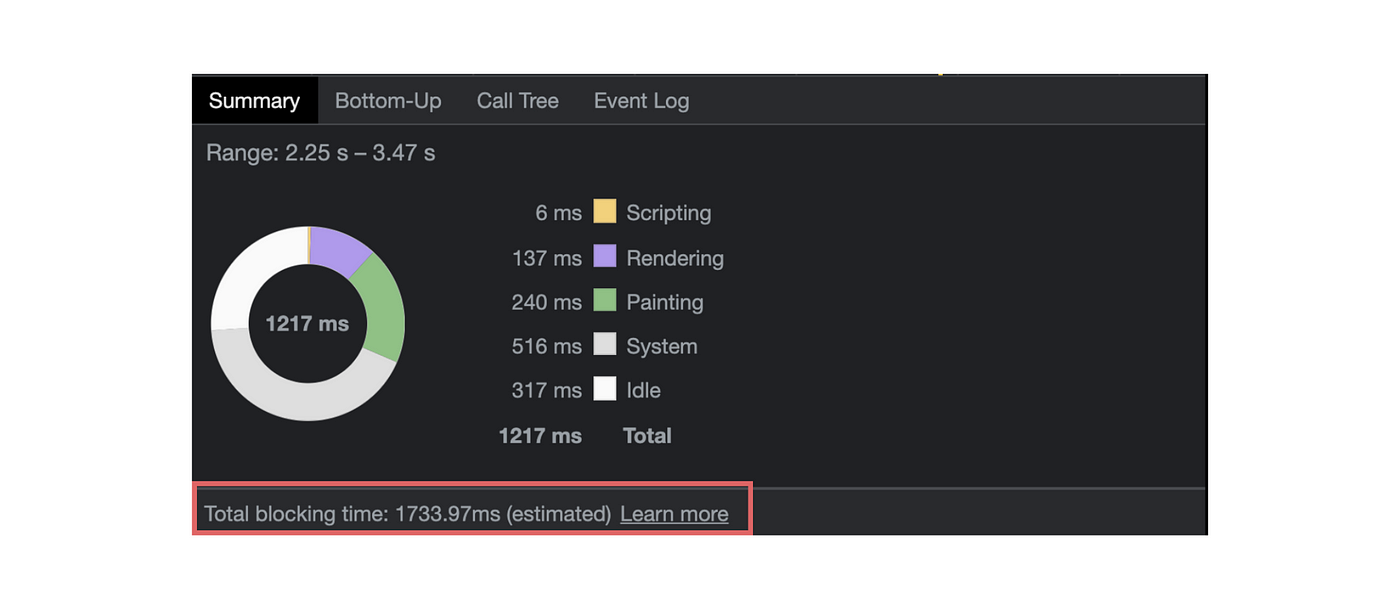
而 CPU 图表有分很多不同的颜色,这代表着不同种类的工作,如果想要更容易懂且统整指定时间区段的图表,可以在 Performance Tab 底下 Summary 看到统整后的图表,颜色的对应与上面的 CPU section 是一样的。
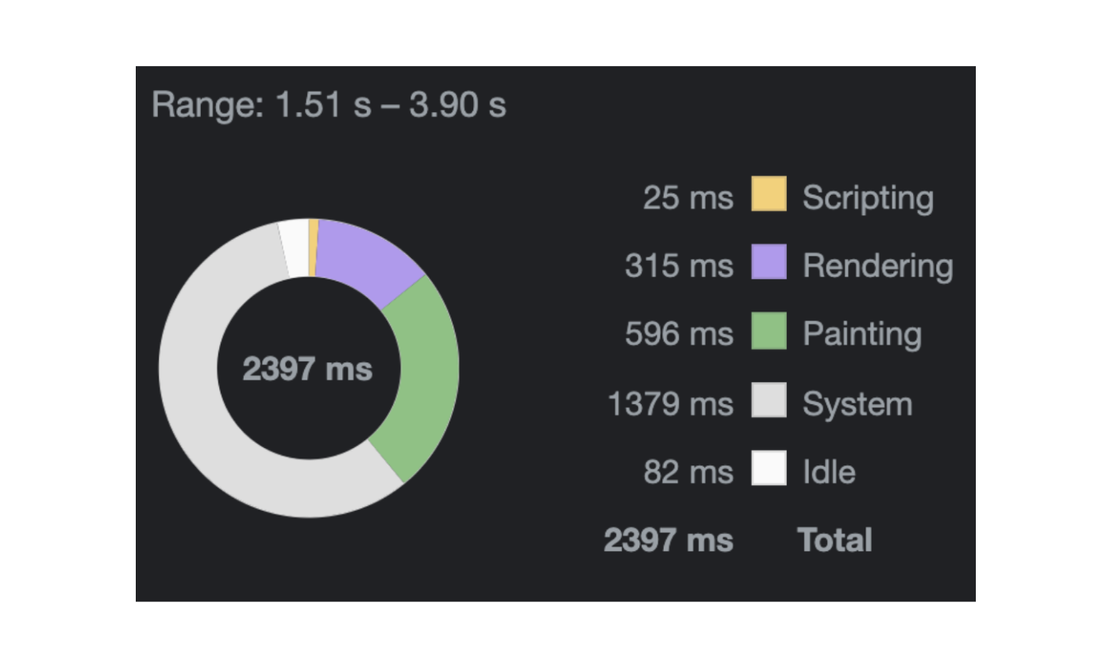
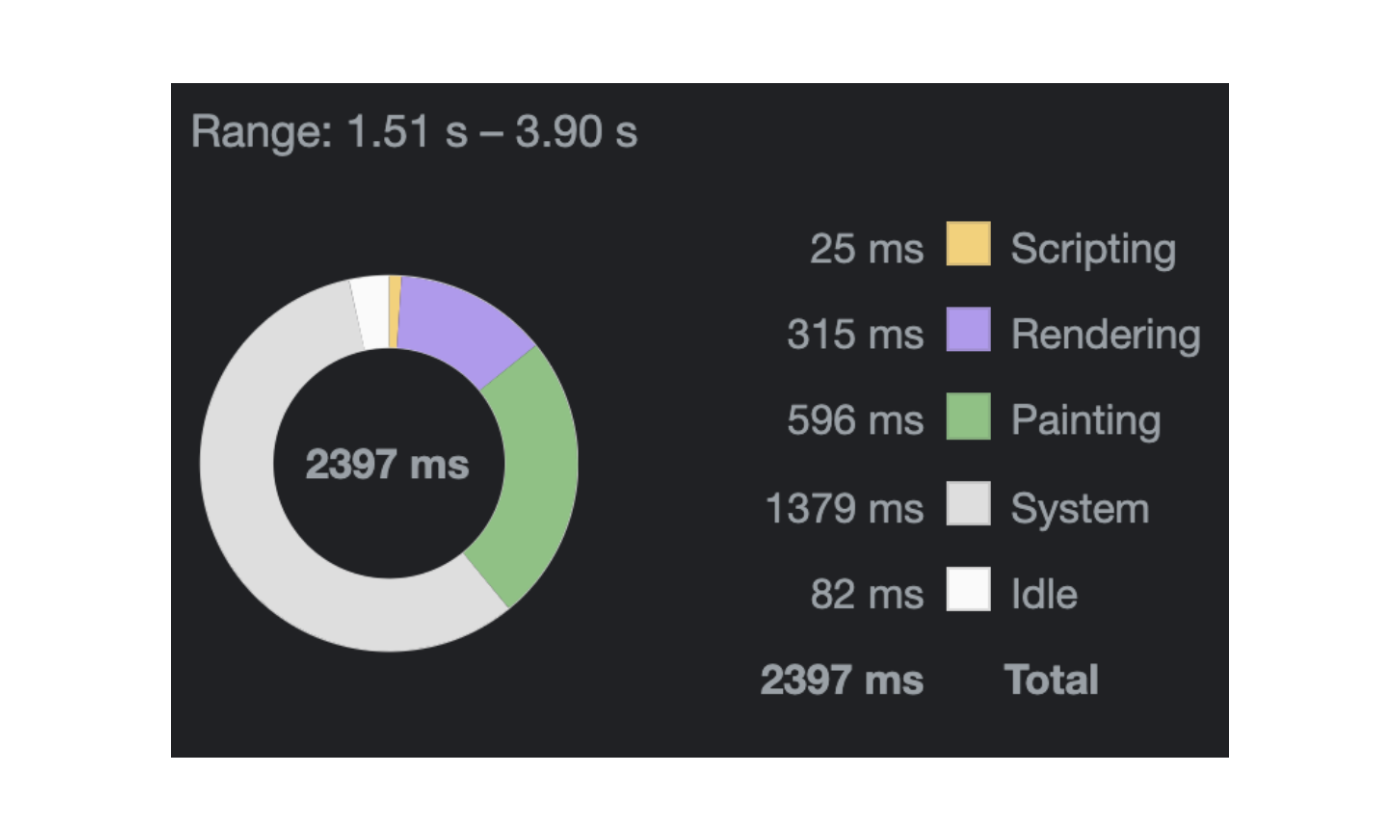
- 灰色 (System)— 浏览器内部的工作 (关于哪些任务被归类在这可以参考这个 stackoverflow 的问题)
- 白色 (Idle)— Idle Time
- 黄色 (Scripting) — 执行 JavaScript 与事件处理
- 绿色 (Painting) — 图像处理、画面绘制
- 紫色(Rendering)—页面的样式计算
- 蓝色 (Loading) — 加载与处理 HTML(因为我是在页面装入后才开始 profiling,因此没有显示这个阶段)
如果你发现你的网页的 CPU 长时间都是保持 maxed out (图表中看起来很繁忙很多工作要做) 的状态,就要注意一下是不是有机会透过 Code Refactor 或是拔除不必要的功能来减轻 CPU 的 Workload。
当然不代表CPU长时间都在运作就是不好的,举例来说asana的官网有一些会无限轮回的动画

这样 CPU 势必会得一直处理一些工作,如果需求是这样,也未必不好

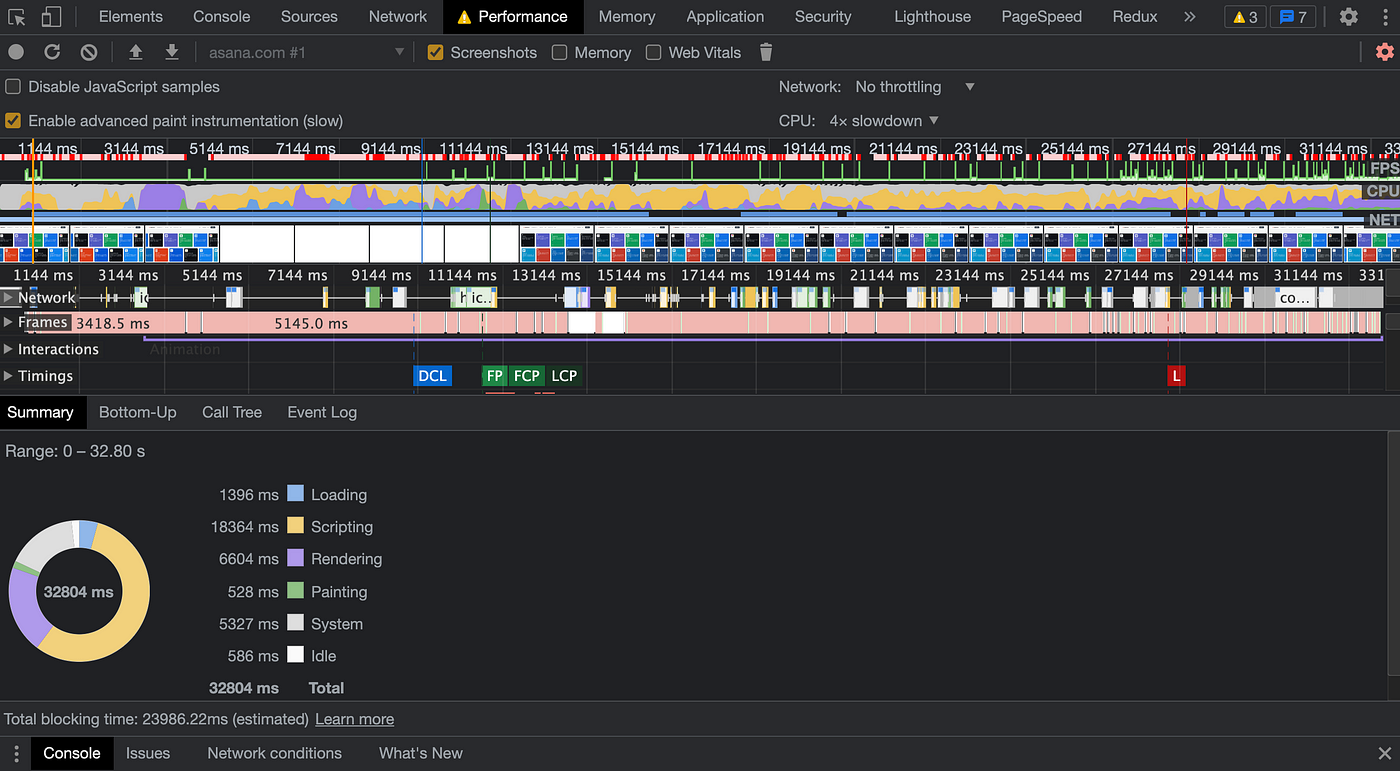
不过可以看得出来掉帧的状况蛮严重的,还有 JavaScript 的执行占了 CPU 的多数时间,这时候可以更近一步去思考如何改善掉帧的问题,或是动画能不能尽量用 CSS 就达到一样的效果
息部分。 因为自己的 demo site 在这边显示的信息太少,所以选择使用刚刚提到的 asana 官网来解释这个区块,而碍于篇幅我只会提到几个我认为比较常会用到的指标 — Memory、Frames、Timing、Main、Network、Experience。
Memory

点选红色区块的Memory选项,下方便会显示这段 profiling 期间网页的内存用量,例如说观测蓝色 JS Heap 使用量的变化我们大致可以观察出网页有没有 Memory Leak 的问题,也可以得知大概是哪些操作会导致内存用量飙升。
橘色区块的垃圾桶则是可以强制浏览器做 GC (Garbage Collection),因为 GC 在 JavaScript 里是不可控的,所以很难只看代码就找出可能产生 Memory Leak 的状况。 藉由强制GC,我们可以观测出执行一个函式前后的内存用量差别。 例如在执行某个函数后就强制 GC,如果内存使用量还是在高点甚至越来越高,也许就是遇到 Memory Leak 的状况了。
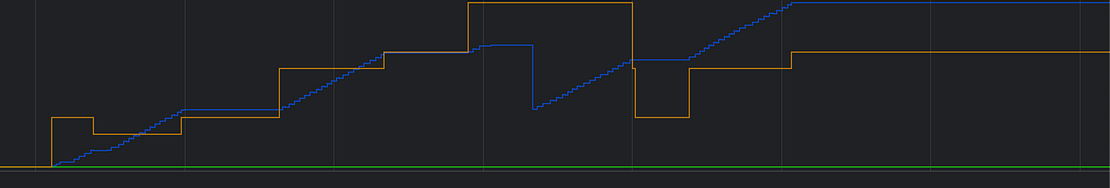
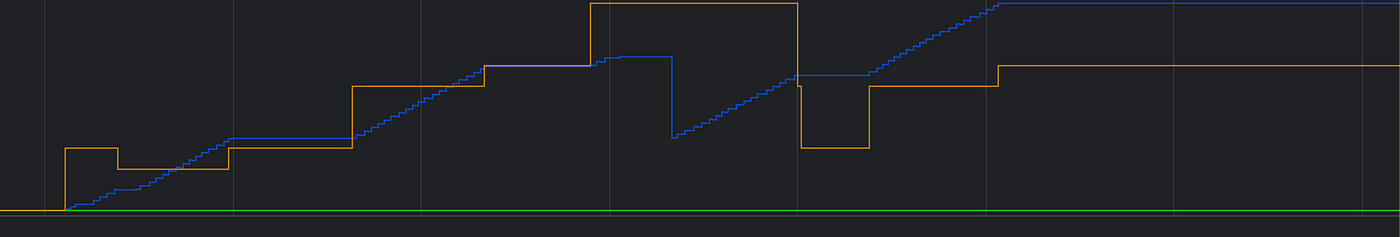
内存回不来,看来是遇到Memory Leak了QQ
如果观察到 GC 是高频率被触发的也不要高兴得太早,虽然可能可以解决 Memory Leak 的问题,但也代表着网站内存的用量有点太多了,GC 有一个特性是「Stop The World」,因为 GC 同样是在 Main Thread 执行,太过频繁可能会导致网站效能出现瓶颈。 若对前端内存管理机制不熟悉的朋友可以参考我之前的文章 — 身为 JS 开发者,你应该要知道的内存管理机制。
Frames
中间区块的 Frames Section 显示了页面中每一次 UI update 的 Screenshot,而每一次 UI update 又可以被称作一个 「frame」。 当 UI 长时间被卡住无法更新时就称作是一个「long frame」。
点击 Frames 中显示的其中一个 frame,下方的 summary tab 会显示该 frame 的详细信息,包括 Duration、FPS 与 CPU Time。


如果点击 summary 中的 Screenshot 还能一步步依照时间顺序浏览被捕捉到的 frames。
Timing


Timing Section 可以看到网页加载性能一些重要指标发生的时间线,这些指标分别有:
- DCL (DOM Content Loaded): ,HTML 被加载且解析(Parse) 完毕的时间点。
- FP (First Paint) : 任何一个 pixel(像素)被浏览器绘制到页面上的时间,例如页面的 background color。
- FCP (First Contentful Paint): 中文为「首次内容绘制」,当浏览者到达网站之后,首次显示网站内容需要的时间,也是指浏览器第一次显示文字或图片的时间,测试第一次显示原因是第二次再显示网站的时候,浏览器已经有快取档案了,因此会没有那么准确。
- LCP (Largest Contentful Paint): 是计算网页可视区 (viewport) 中最大元件的加载时间,也就是页面的主要内容被用户看到的时间,是速度的指标。
- L (onload) : 代表解析 HTML 后请求的资源都加载完成的时间点
在 Performance Tab 的最下方也会显示 Total Blocking Time (TBT),代表在 Profiling 的过程中,浏览器 Main Thread 被阻塞的时间总和,当然我们会希望这个时间可以越短越好。

Experience


从 Experience 可以看出哪里会发生 Layout Shift,也就是 Core Web Vital 中大家十分在意的 CLS。
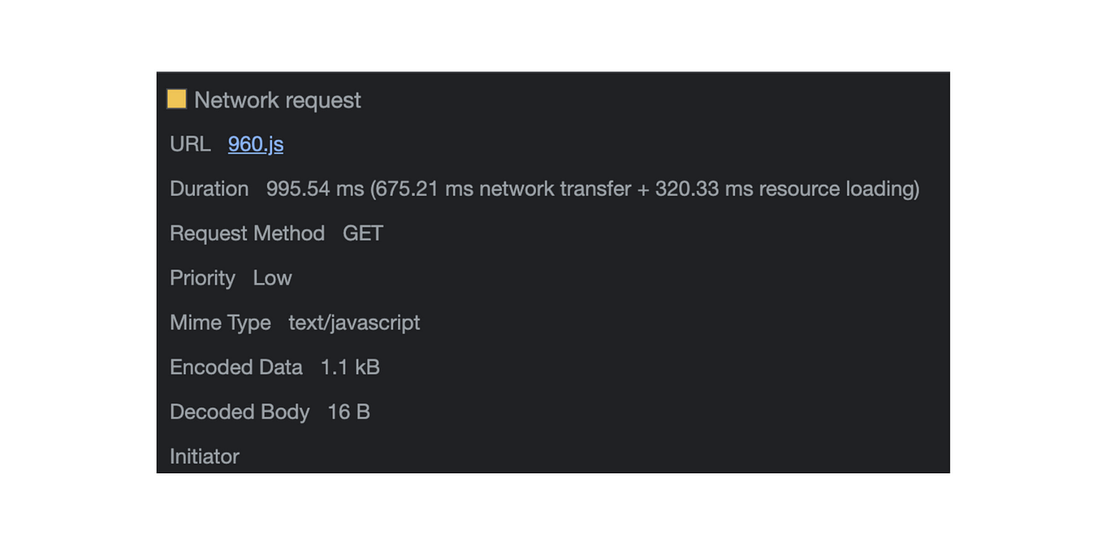
Network
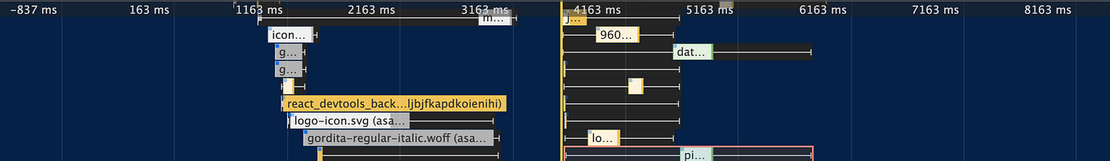

按照顺序显示抓取各个资源花费的时间和资源间的依赖关系,如果点击任一资源可以在下方 summary tab 看到更详细的资料,例如 URL、Duration、Priority、Mime Type、Encoded Data 大小、Decoded Body 大小。
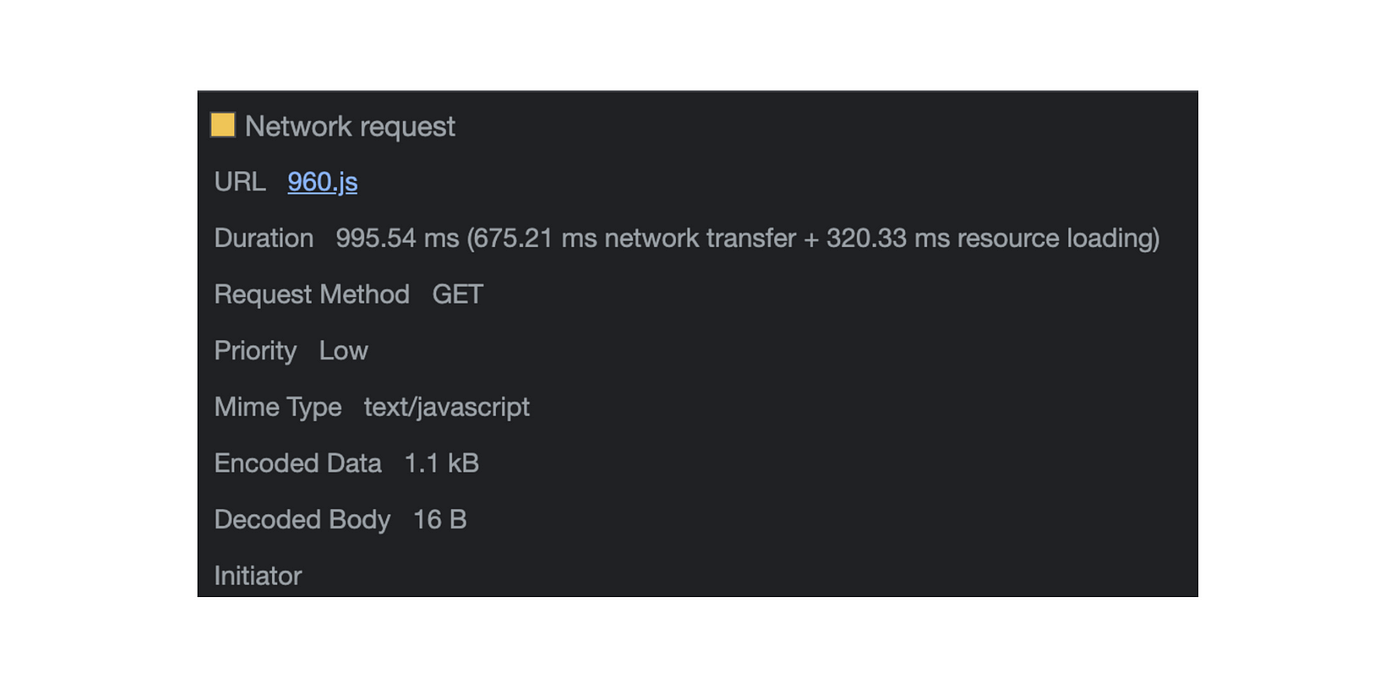
不过笔者通常在debug networking相关的资源时还是比较常直接使用Devtool的Network Tab,整体信息更为详细且直觉。
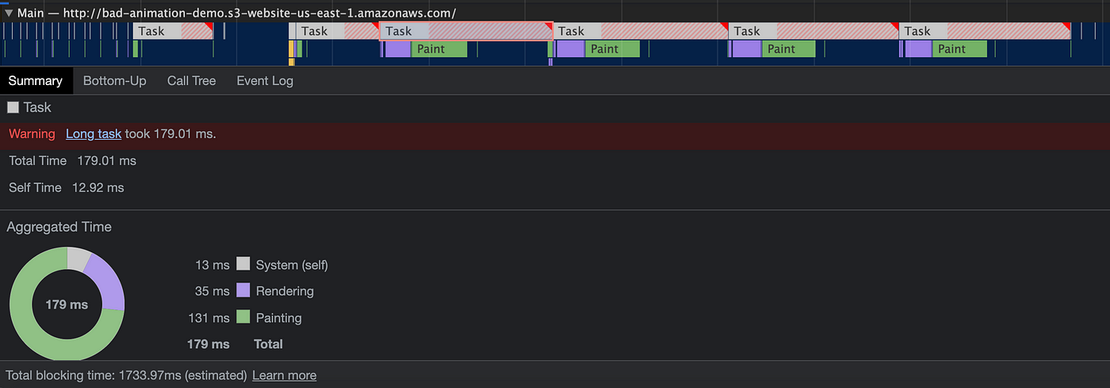
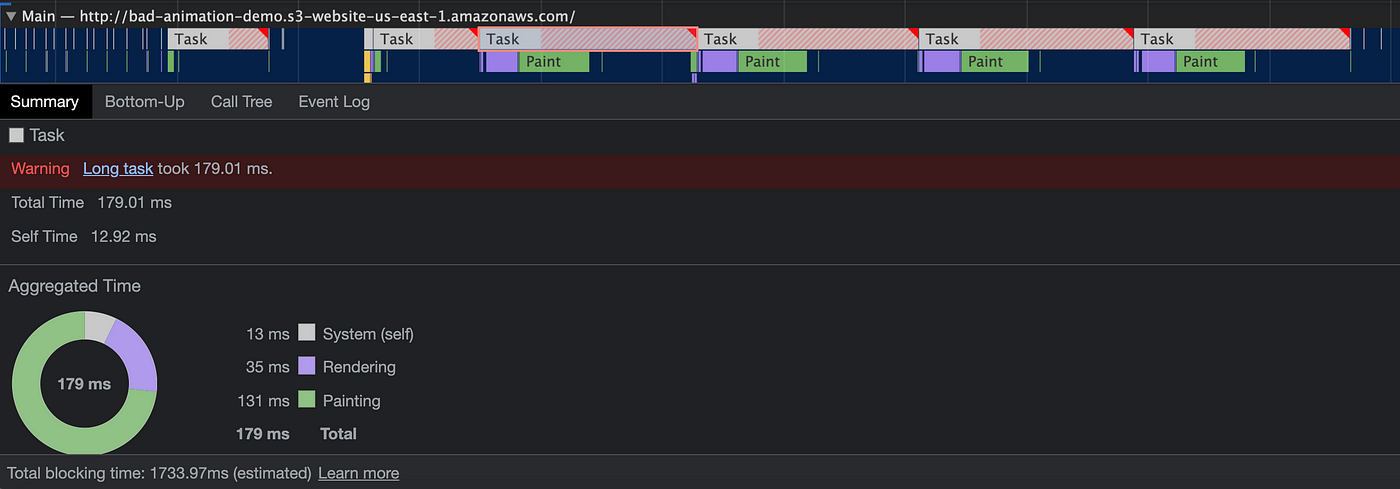
Main (CPU Flame Chart)
Main Section 呈现的是Main Thread的CPU task,并且采用倒转的火焰图(flame chart)的形式呈现,意思是在下面的 function 或 task 是由上一层的 task 所触发的,我们可以利用这点追踪各个 task 与 function 的依赖与触发关系。
如果 Task 的右上角出现红色的三角形,代表这是一个 long task,同时这也是一个告诉我们这里可能有出现一些问题导致 task 执行时间过长的警告。
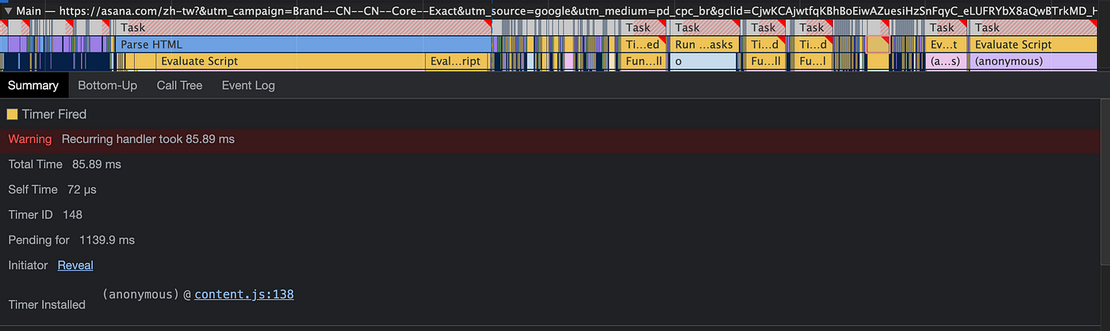
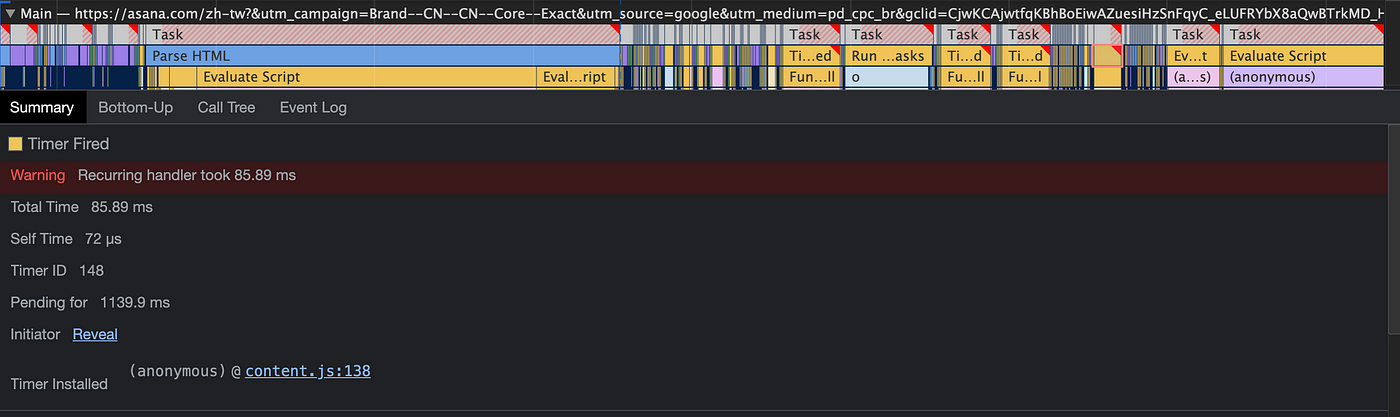
点击有红色三角形的 task 后,会出现如上图的详细信息,有时候它会指出这个 task 在代码中的位置,让我们可以更快速的 debug 找出潜在的问题,例如我们点击上面显示的 content.js
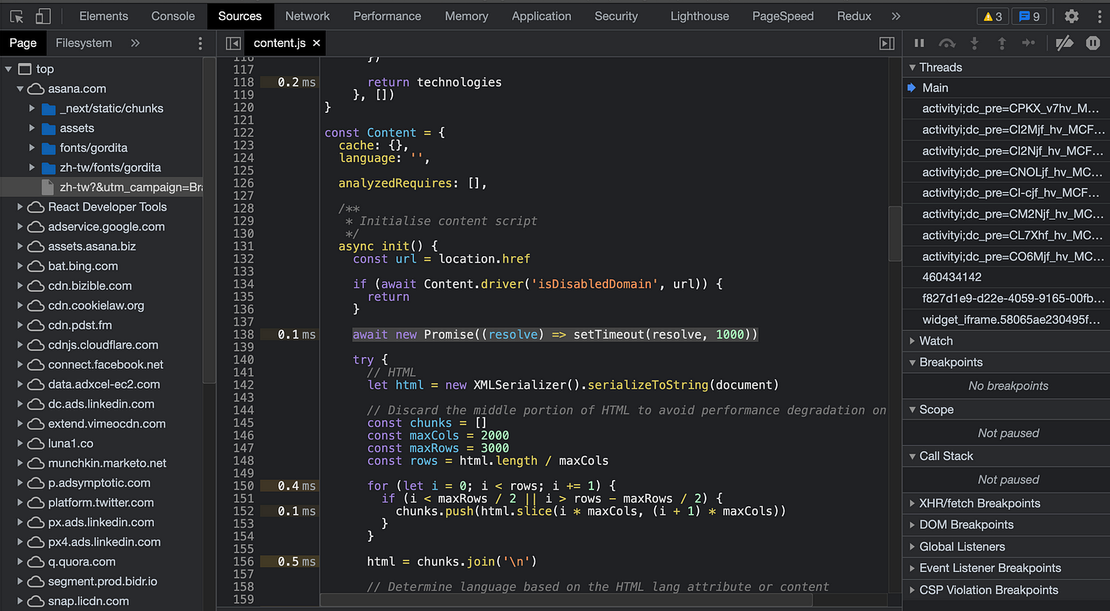
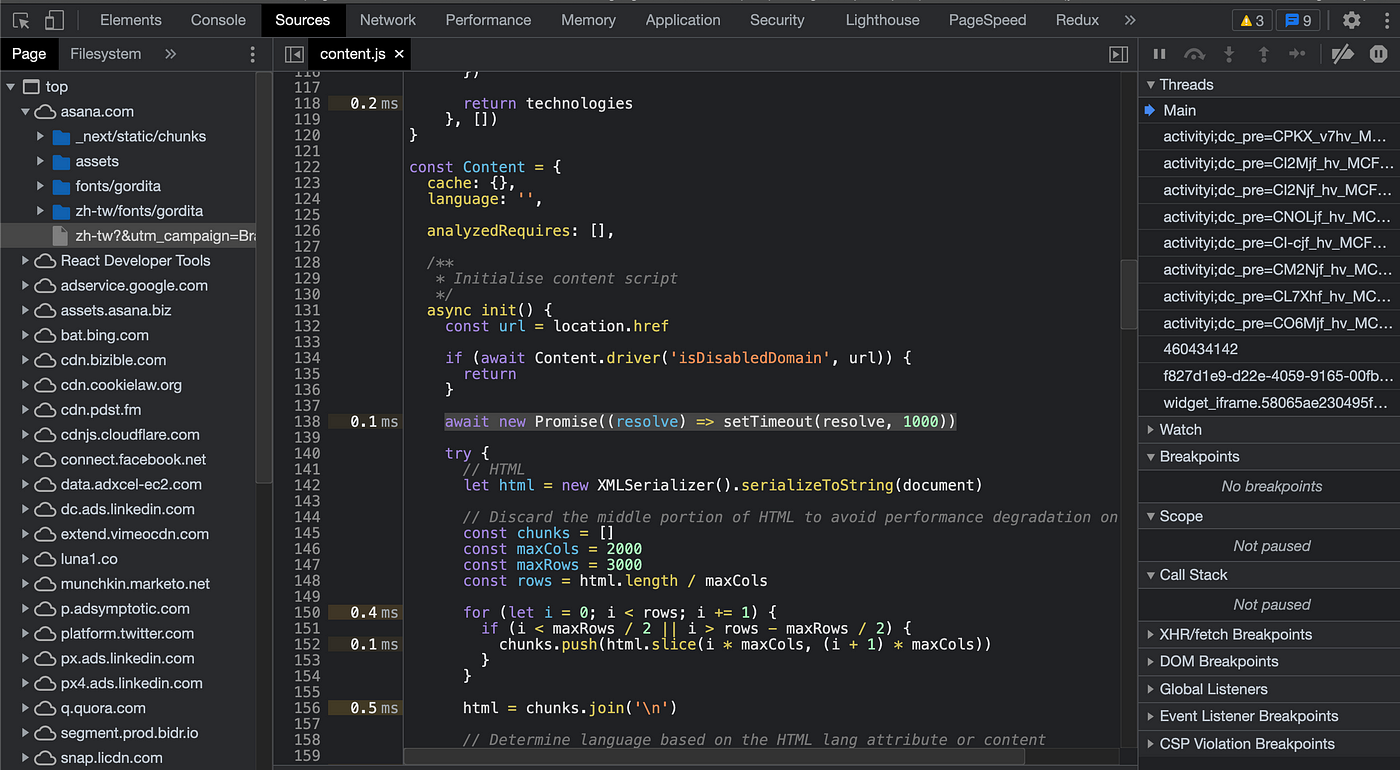
会直接切换到 Sources Tab 并显示对应的行数,对于 Debug 来说非常方便。


有时候你会发现除了 Main,还多了其他的 Frame 与 Worker ,这些 Frame 指的不是刚刚提到可以观测 FPS 的 Frames,而是指网页中有嵌入的 iframe,而 Worker 指的是 Web Workers 等除了 Main Thread 以外的执行绪,Performance Tab 连这些都可以 debug,真的非常令人惊艳。
一些遗珠之憾
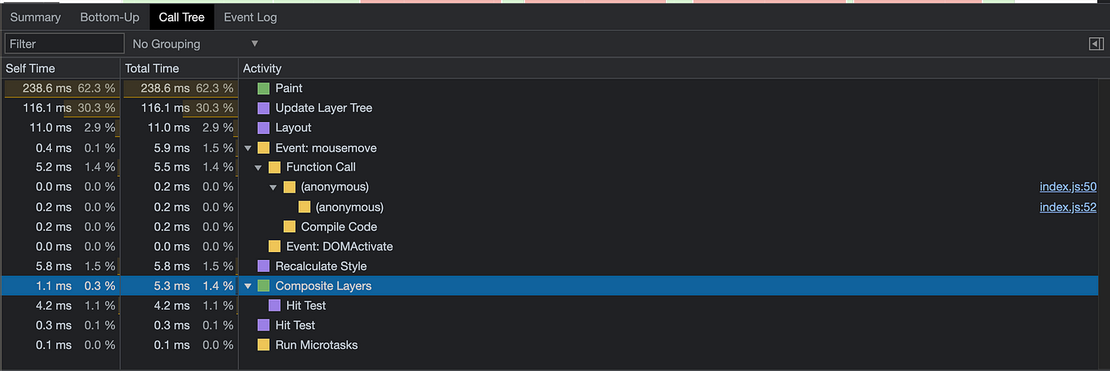
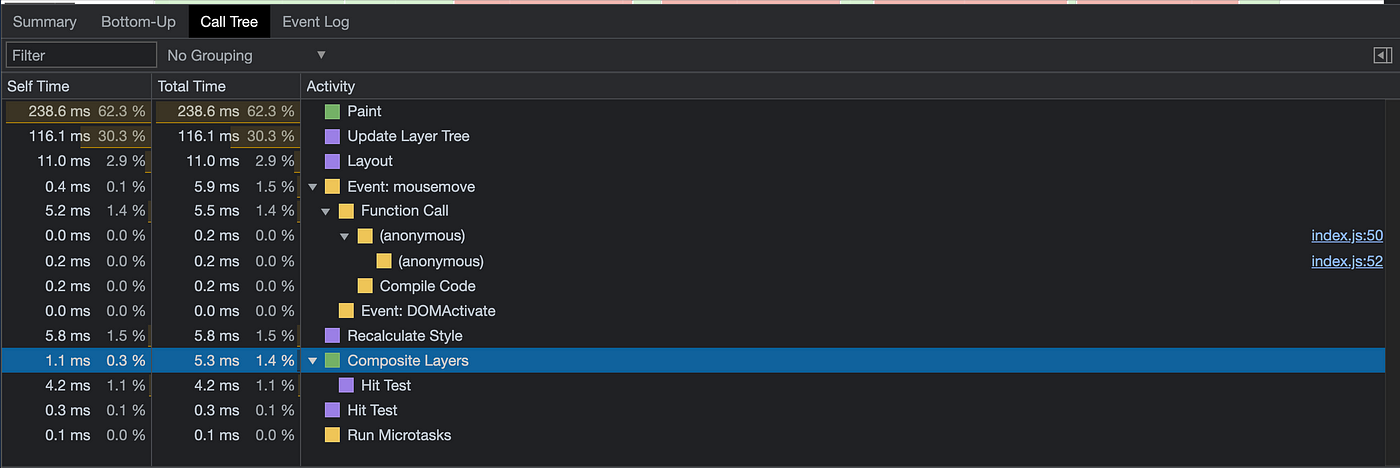
碍于篇幅,其实 Performance Tab 上还有很多丰富的信息没有介绍到,例如关于 Layer 相关的资讯、Advanced Paint Instrumentation,还有 Summary Tab 底下关于 Call Tree、Bottom-Up 等可以更细粒度的观察 CPU 活动的区块,蛮建议有兴趣与有需要的读者可以自行研究一下。
所以说,网站动画经过Refactor后究竟对效能产生多少影响?
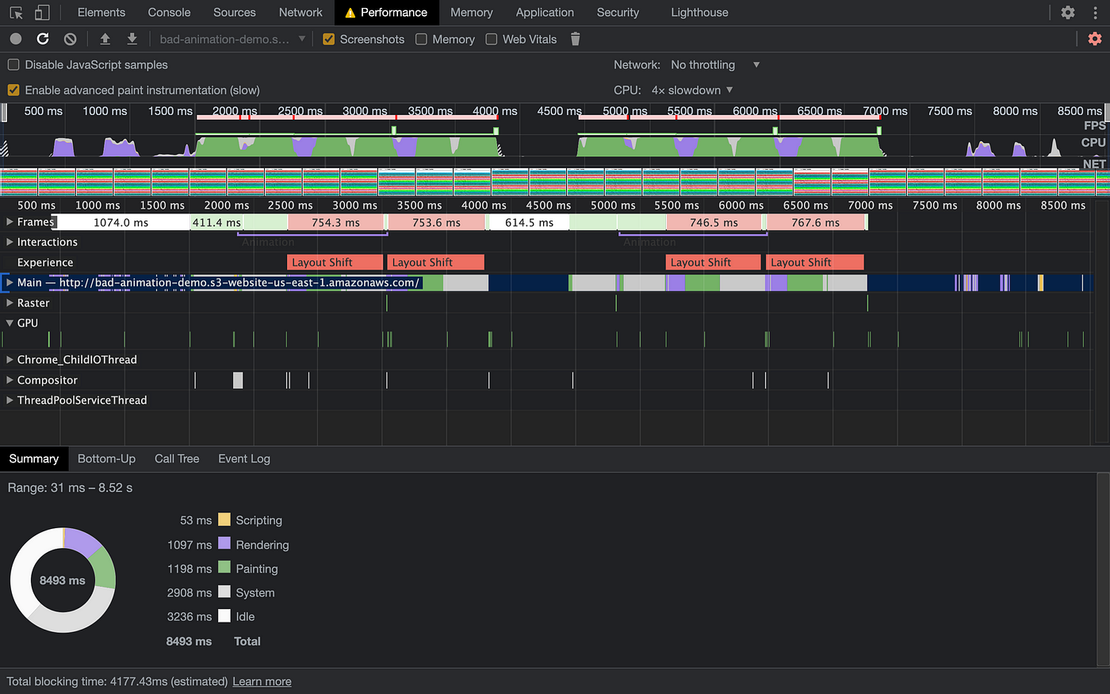
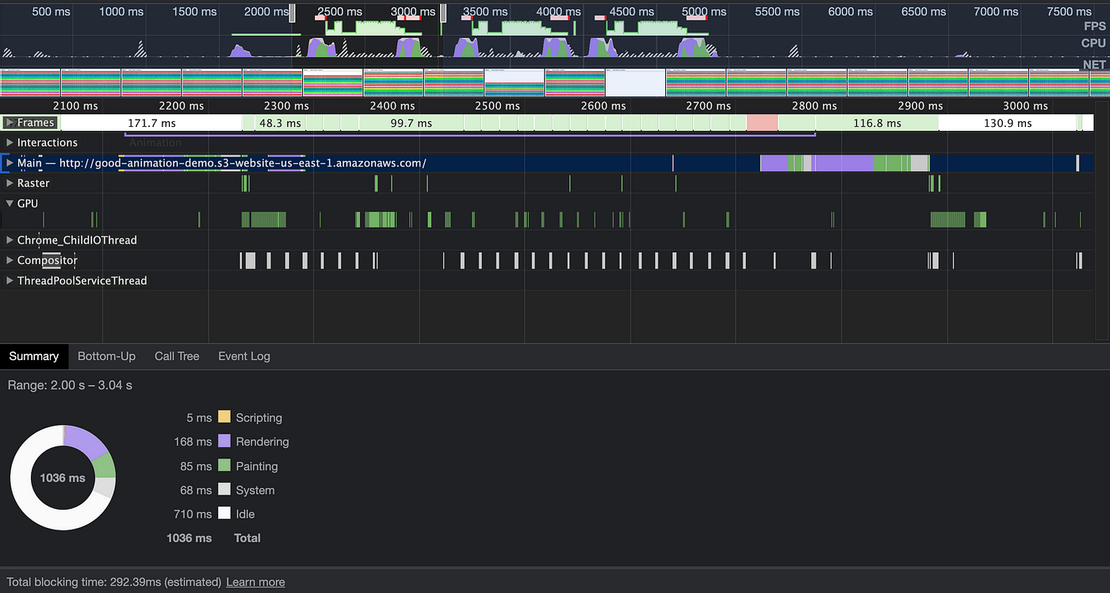
理解了 Performance Tab 基本的操作方式后,回过头来看看用来 Demo 的网站在 Performance Tab 的分析状况。
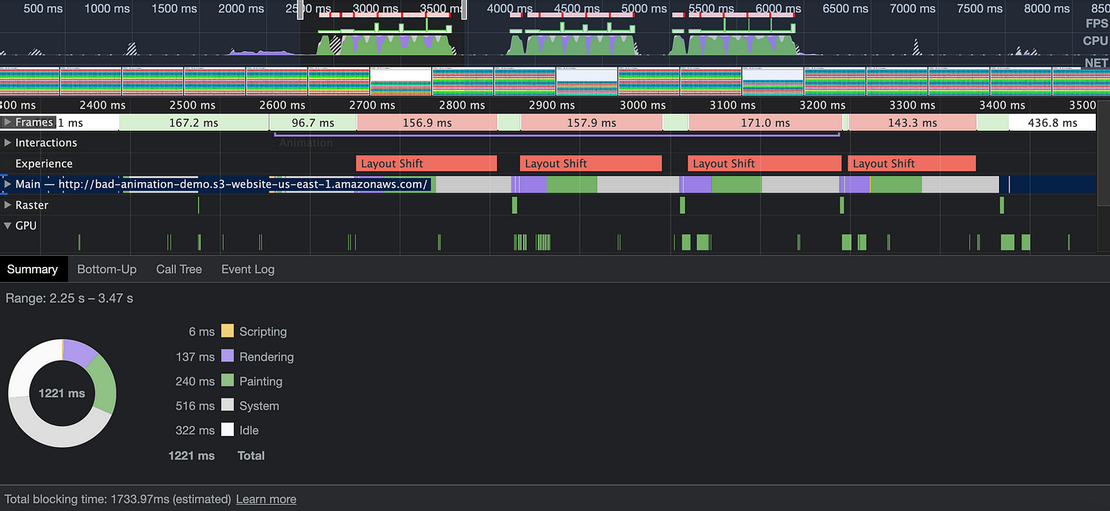

可以看出在动画触发时基本上会严重掉帧, CPU 的工作量也会变得很大,主要在做的事是 Rendering(紫色)与 Painting(绿色),Idle(白色)的时间并不多,有可能会导致没办法处理用户的 input 行为。
按照刚刚介绍的方式,也可以进一步去看在 Main Section 标示为 long task 的任务,发现大部分的时间都花在 painting 上了,且花费的时间非常久,依照 RAIL Model 的标准,这样的时间花费会让用户感受到页面的卡顿, 甚至用户互动所触发的事件浏览器也会没办法及时处理,用户体验非常不好。
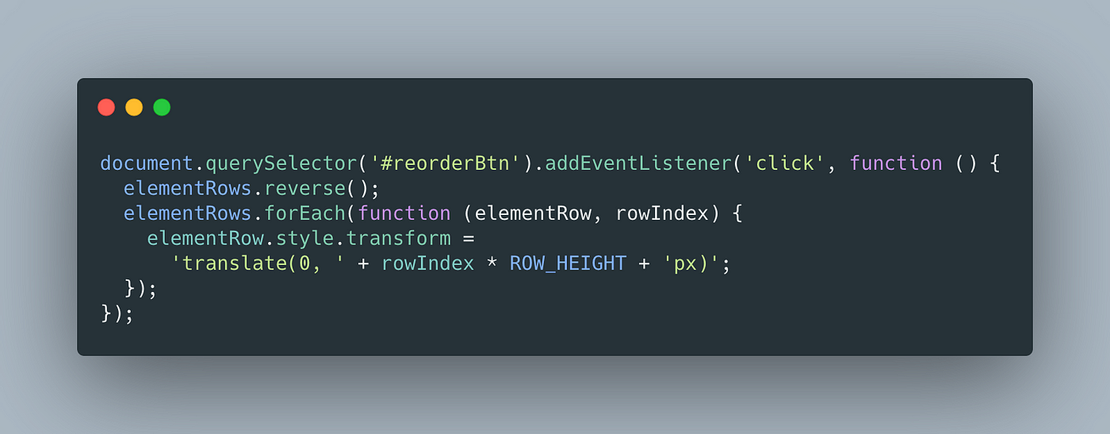
到这里大致上可以确定这个版本的动画有很大的问题,既然确定了问题,我们就来看看动画的 code
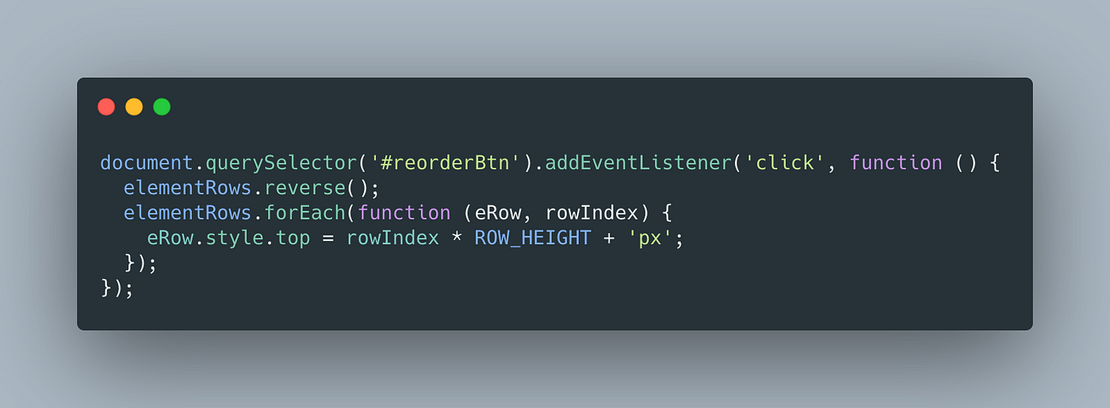
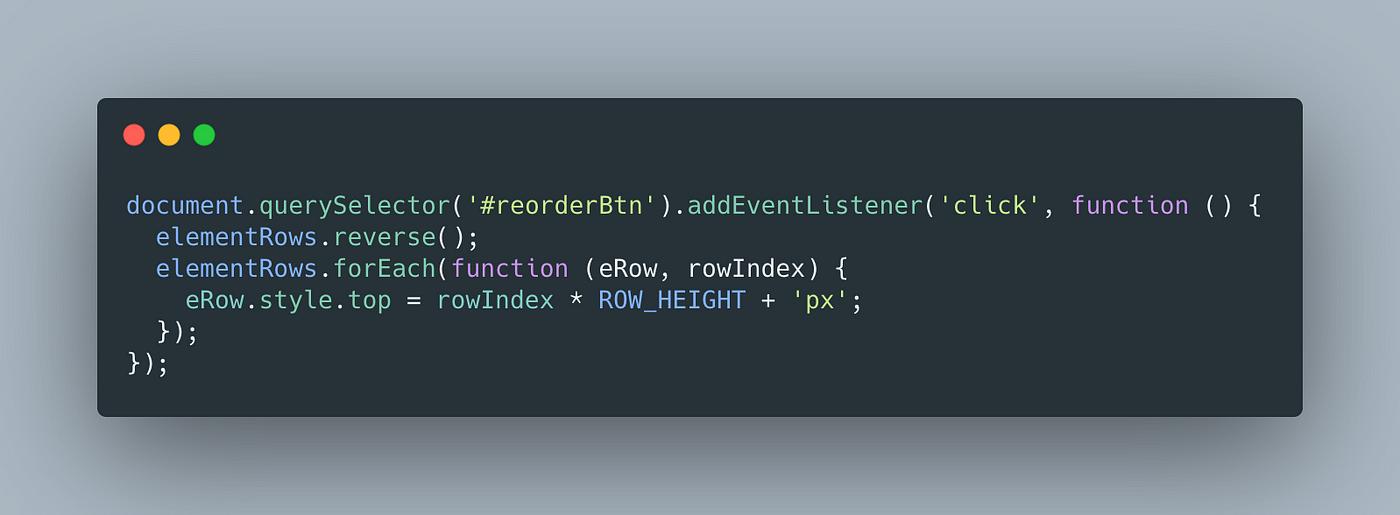
发现这段code是直接改变element的 top 来达成动画,这会造成页面每次都需要经过Reflow重新计算Layout。 但我们应该有更好的方式可以达成一样的动画效果的,于是我试着将 code 改成以下这样
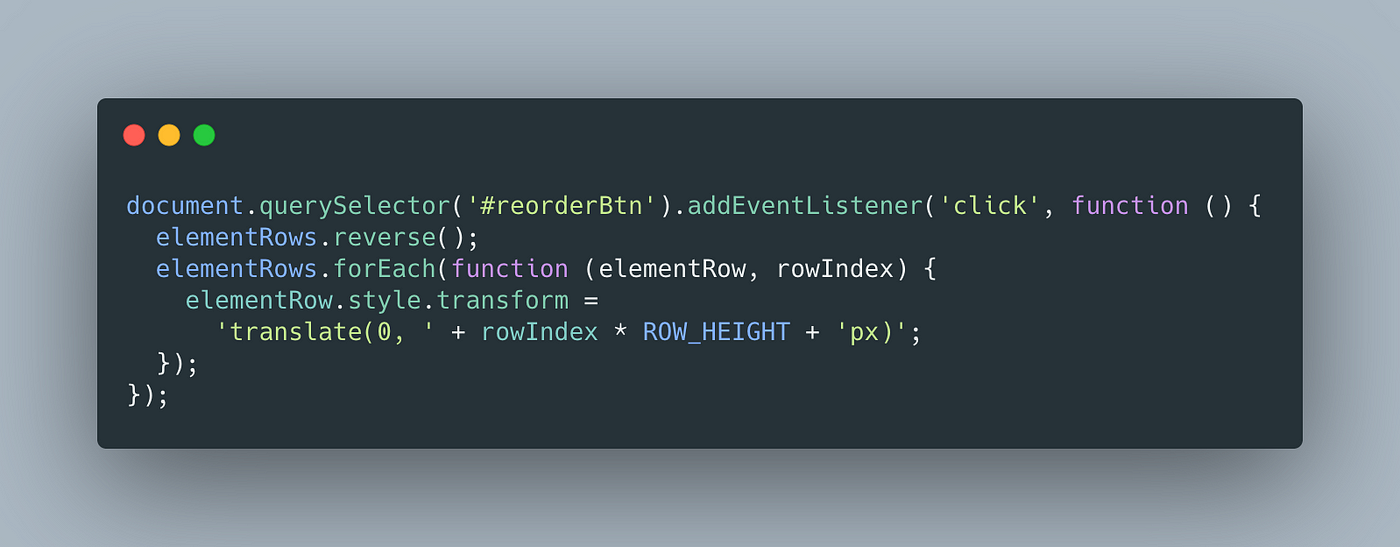
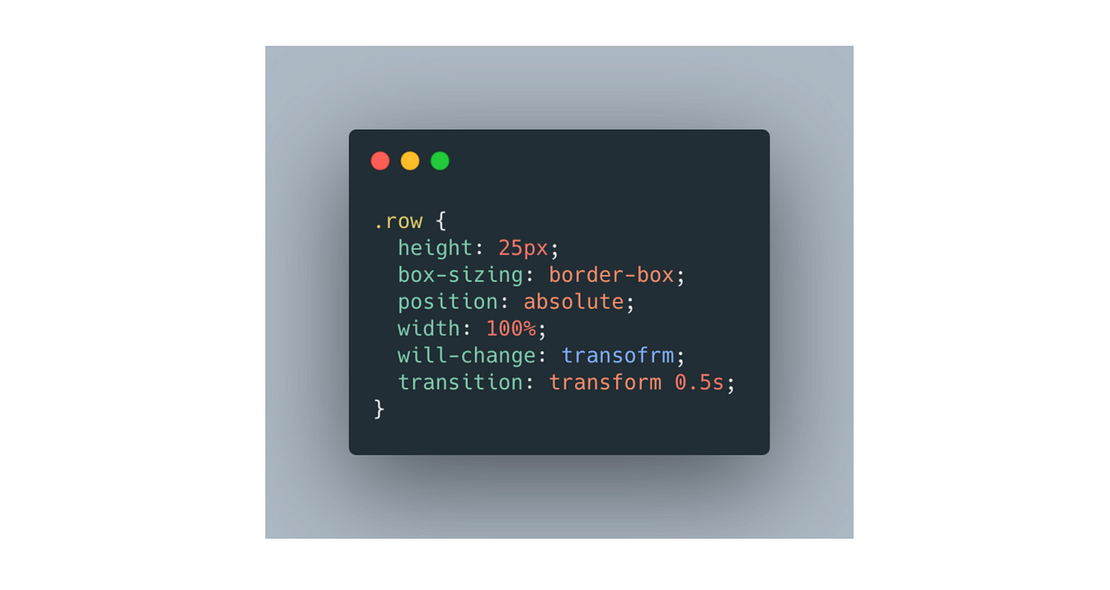
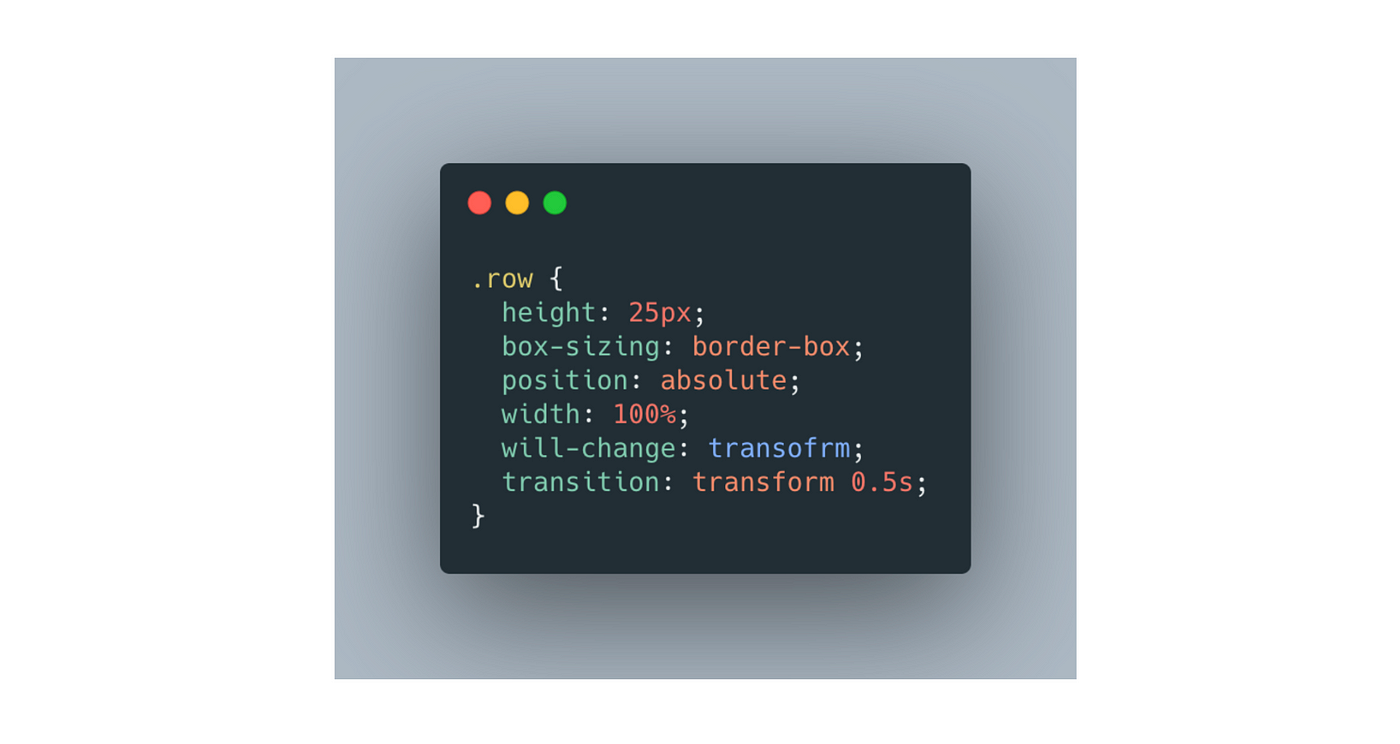
并且使用 will-change CSS 属性在 transform 上
接着我们直接对新版的网站进行 Performance Profiling
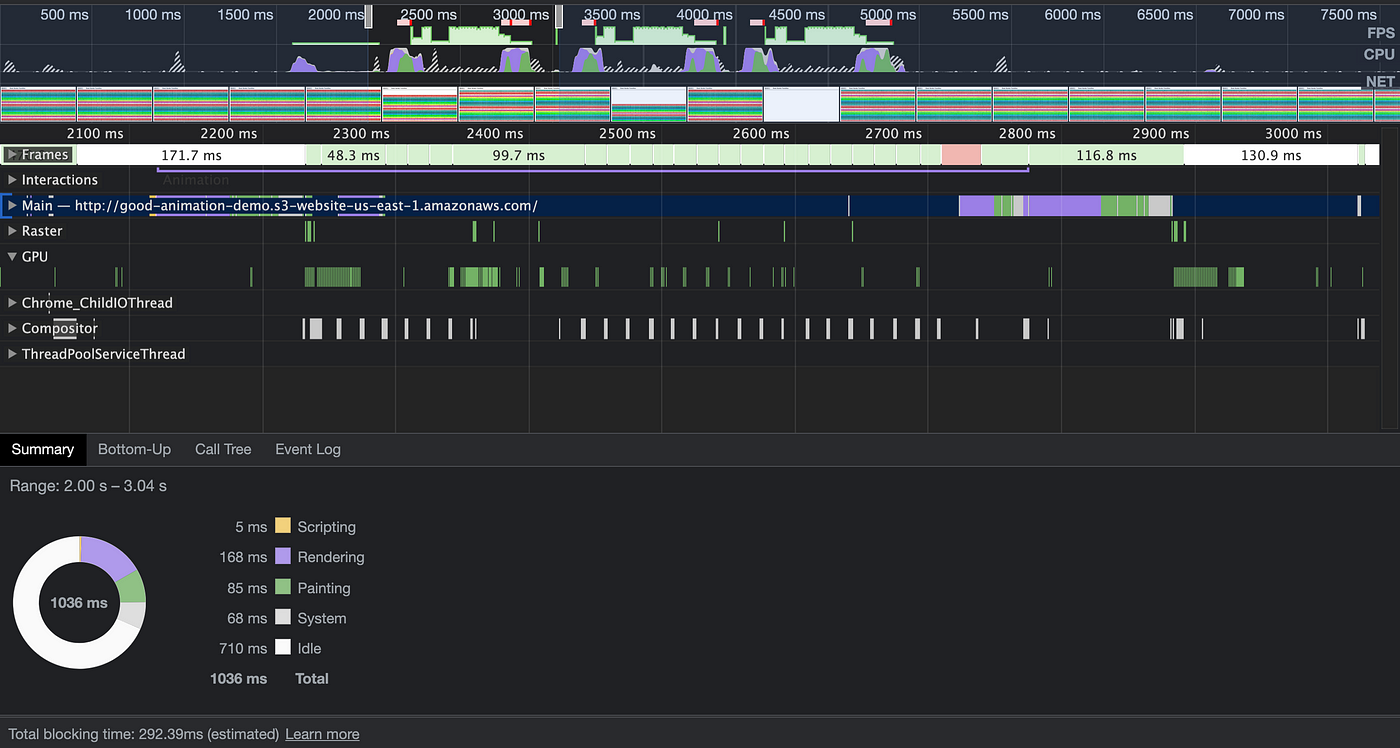
可以发现 frame rate 与 CPU 使用量都优化非常多,从 summary tab 也可以发现同样是差不多一秒左右的时间,新版网页的 Idle Time 变多了,代表更有机会可以处理用户的 input,避免用户感受到整个网站是失去响应的。
虽然改版后还是有些失帧的状况,应该还能再更加改进,但比起上一版已经改善非常多。
透过这个简单的范例,各位读者未来在遇到页面不流畅或是卡顿等问题时应该就比较知道怎么 debug ,在修正写法后也知道如何比对是不是真的有改善。
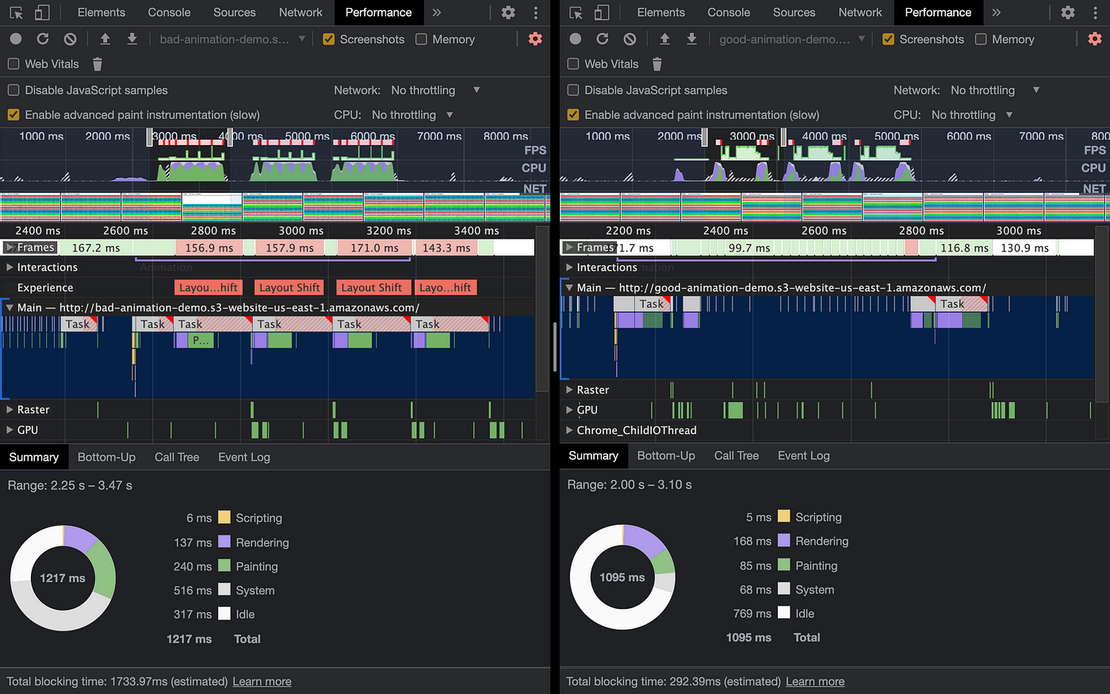

前后版本的 Profilling 对比
结论
现在的网站十分依赖与看重像 Lighthouse 这种效能检测工具所算出的分数,但笔者就曾经遇过明明 Lighthouse Performance 分数是满分,在使用时却有明显卡顿与不流畅的状况。 这代表我们不能完全相信与依赖这些分数,当用户亲身遇到效能体验不佳的状况时,Runtime Performance 的 Debugging 就变得十分重要。 虽然今天只有介绍到皮毛,但希望这篇文章能够让各位在未来需要使用 Performance Tab 时不再被眼花缭乱的 Dashboard 震慑住,而可以清楚地知道要如何去找出问题的瓶颈。
 微信扫一扫
微信扫一扫
相关推荐
-
传三星再推Galaxy Fit3智慧手环,有21天续航
三星的穿戴式设备除了Galaxy Watch手表外,过去还有价格较亲民的Galaxy Fit系列,不过最后一款Galaxy Fit2已经是2020年的产品,如今有传闻在暌违三年后,…
-
Epic Games在对抗Google的法庭上承认,Epic商店至今赤字未获利
Epic Games 在一年多前因为其《要塞英雄》开启了绕过苹果官方的付费功能,被苹果以违反平台守则下架开始,正式对两大公司苹果与 谷歌 展开商店平台抽成之战,诉讼持续至今,在本周…
-
iPhone 15 相机怎么设置ProRAW功能
iPhone 15都搭载了4800万像素主摄,但是很多的小伙伴表示:这拍起来看着和1200w的像素也没有区别啊。大家一定要关注一个功能,那就是ProRAW功能,打开这个功能之后,放…
-
AMD 新版 AMD Software: Adrenalin Edition 驱动软件,提供《星球大战绝地:幸存者》Day-0支持
为《星球大战绝地:幸存者》提供Day-0支持,同时修正首次启动《最后生还者一部曲》时着色器编译时间较长的情况。 AMD释出AMD Software: Adrenalin Editi…
-
iPhone 电池全攻略:健康度查询、保养与换电池信息一次看
iPhone 电池可以说是 iPhone 相当重要的一项零件,关乎到 iPhone 可以用多久,所以很多人对于 iPhone 电池健康度相当重视,今天这篇文章就要跟大家分享关于 i…
-
好个“菁婴”! 《模拟市民4》小北鼻竟被征召入伍 使命召唤只给你24小时准备
《模拟市民4》近日推出全新扩充内容「成长路上」,追加婴儿阶段,让玩家模拟育儿的过程。 不过有些婴儿堪称菁英中的菁婴,还没学会走就被征召上战场。 养到菁英宝宝的,是 Reddit 用…